

Specialty Mushroom Sales and Performance Review
Sales, shares and performance by type, package size, and region
Explore specialty mushroom sales data, market share trends, and performance insights across product types, package sizes, and regional markets based on the latest retail data.
Gain actionable mushroom industry insights to support merchandising, distribution, and category growth strategies.
Specialty Mushroom Review
Specialty Mushroom Share of Market
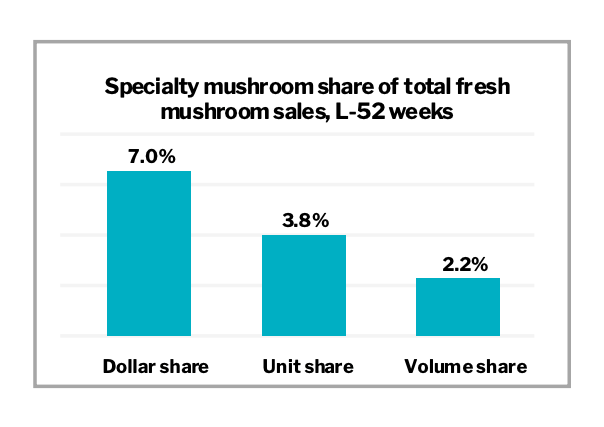
Specialty mushrooms represented 7.0% of total fresh mushroom dollar sales in retail channels excluding ethnic or organic stores in the past year (“traditional retail”). The Circana MULO+ universe does not include Asian store formats such as H-Mart and Lotte, nor Whole Foods and Sprouts, which all have a large presence of specialty mushrooms compared to most traditional supermarkets, supercenters, clubs, etc.
The specialty mushroom share of business in traditional retail is down from 7.2% the prior year but up from 6.6% two years ago. The unit (3.8%) and volume/pound (2.2%) shares are far smaller. Both declined a little bit from their 2024 levels.
Specialty mushrooms generated $102 million in the latest 52 weeks. Dollars, units and pounds are trending down compared to last year’s levels. While white and brown mushrooms are experiencing year-over-year decreases as well, specialty mushroom sales are declining at a greater rate.
|
Product |
Dollar Sales |
Dollar Sales % Change vs YA |
Dollar Sales % Change vs 2 YA |
Unit Sales |
Unit Sales % Change vs YA |
Unit Sales % Change vs 2 YA |
Volume Sales |
Volume Sales % Change vs YA |
Volume Sales % Change vs 2 YA |
|---|---|---|---|---|---|---|---|---|---|
|
Total fresh mushrooms |
$1.45B |
-5.1% |
-6.7% |
485.0M |
-3.9% |
-6.3% |
324.4M |
-3.4% |
-5.8% |
|
White mushrooms |
$713.8M |
-5.3% |
-8.0% |
269.6M |
-4.6% |
-8.3% |
180.2M |
-3.9% |
-8.0% |
|
Brown mushrooms |
$633.0M |
-4.5% |
-6.1% |
197.0M |
-2.7% |
-3.5% |
136.9M |
-2.6% |
-2.8% |
|
Specialty mushrooms |
$101.9M |
-6.8% |
-1.3% |
18.3M |
-6.7% |
-5.5% |
7.3M |
-6.7% |
-2.1% |
Specialty Mushroom Sales by Type (MULO+ | 52 weeks ending 11/2/2025
- Shiitake mushrooms are easily the largest of the specialty varieties, with annual sales of $66 million
- Shiitake represents 64.8% of total specialty mushroom dollar sales, 63.2% of unit sales and 60.6% of volume sales
- Mixed mushroom packages are the second largest segment.
- Dollar sales are down year-over-year for the five largest segments, whereas smaller ones, such as lion’s mane, trumpet, beech and enoki mushrooms gained ground year-over-year.
- Unit and volume patterns are equally mixed, with year-over-year gains for lion’s mane, trumpet and enoki.
|
Product |
Dollar Sales |
Dollar Sales % Change vs YA |
Dollar Sales % Change vs 2 YA |
Unit Sales |
Unit Sales % Change vs YA |
Unit Sales % Change vs 2 YA |
Volume Sales |
Volume Sales % Change vs YA |
Volume Sales % Change vs 2 YA |
|---|---|---|---|---|---|---|---|---|---|
|
Total fresh mushrooms |
$1.45B |
-5.1% |
-6.7% |
485.0M |
-3.9% |
-6.3% |
324.4M |
-3.4% |
-5.8% |
|
Total specialty mushrooms |
$101.9M |
-6.8% |
-1.3% |
18.3M |
-6.7% |
-5.5% |
7.3M |
-6.7% |
-2.1% |
|
Shiitake mushrooms |
$66.0M |
-4.3% |
-5.4% |
11.6M |
-4.9% |
-8.3% |
4.4M |
-5.4% |
-5.5% |
|
All other fresh mushrooms |
$11.5M |
-7.5% |
+25.8% |
2.0M |
+3.3% |
+37.0% |
899K |
+5.9% |
+41.9% |
|
Mixed mushrooms |
$8.6M |
-11.2% |
-19.9% |
2.0M |
-10.9% |
-21.7% |
823K |
-15.2% |
-26.0% |
|
Oyster mushrooms |
$7.5M |
-18.7% |
+1.6% |
1.8M |
-25.9% |
-16.5% |
551K |
-24.2% |
-14.4% |
|
Chanterelle mushrooms |
$6.2M |
-15.0% |
+32.5% |
488K |
-4.8% |
+62.8% |
466K |
-4.5% |
+64.2% |
|
Lion’s mane mushrooms |
$902K |
+29.2% |
+53.5% |
203K |
+24.9% |
+38.4% |
53K |
+18.2% |
+35.1% |
|
Trumpet mushrooms |
$532K |
+18.3% |
+13.7% |
123K |
+61.1% |
+66.7% |
36K |
+35.0% |
+27.8% |
|
Beech mushrooms |
$374K |
+13.8% |
+13.7% |
100K |
+2.9% |
+69.2% |
22K |
-5.7% |
+53.7% |
|
Morel mushrooms |
$103K |
-32.5% |
-28.6% |
5K |
-14.6% |
-30.3% |
2K |
-39.1% |
-40.5% |
|
Enoki mushrooms |
$93K |
+179.9% |
+258.0% |
29K |
+192.1% |
+333.3% |
19K |
+86.4% |
+98.6% |
Understanding the Impact of Distribution (MULO+ | 52 weeks ending 11/2/2025)
- Distribution is highest and mostly unchanged for white and crimini mushrooms.
- Portabella mushrooms have distribution in less than two-thirds of stores and experienced a small decline.
- In total, specialty mushrooms have distribution in a little more than 40% of the traditional grocery channels (excluding ethnic formats).
- This is down by nearly three percentage points compared to last year, after peaking in 2023. • Among the specialty varieties, shiitake have the highest distribution, though lost two percentage points year-over-year.
- Oyster mushrooms have the second-widest distribution that peaked in 2024.
- All other varieties have distribution of less than 5%. While growing, this growth is off a very small base.
|
Product |
Share of specialty mushroom sales |
Average Weekly ACV Distribution |
Average Weekly ACV Distribution YA |
Average Weekly ACV Distribution 2YA |
Average Weekly ACV Distribution 3YA |
Difference in distribution vs. YA |
% difference in distribution vs. YA |
|---|---|---|---|---|---|---|---|
|
White mushrooms |
— |
82.35 |
82.40 |
82.48 |
82.25 |
-0.05 |
-0.1% |
|
Crimini mushrooms |
— |
75.74 |
75.94 |
76.35 |
75.41 |
-0.20 |
-0.3% |
|
Portabella mushrooms |
— |
63.60 |
64.61 |
65.75 |
65.01 |
-1.01 |
-1.6% |
|
Total specialty mushrooms |
100.0% |
40.35 |
43.03 |
45.32 |
43.03 |
-2.68 |
-6.8% |
|
Shiitake mushrooms |
64.8% |
36.17 |
38.04 |
38.62 |
37.01 |
-1.87 |
-4.9% |
|
All other fresh mushrooms |
11.3% |
9.99 |
10.41 |
11.66 |
10.52 |
-0.42 |
-4.0% |
|
Mixed mushrooms |
8.4% |
12.40 |
11.40 |
11.63 |
11.91 |
+1.0 |
+8.8% |
|
Oyster mushrooms |
7.3% |
16.23 |
17.34 |
14.17 |
13.96 |
-1.11 |
-6.4% |
|
Chanterelle mushrooms |
6.1% |
3.64 |
3.09 |
2.58 |
2.01 |
+0.55 |
+17.8% |
|
Lion’s mane mushrooms |
0.9% |
2.94 |
1.64 |
1.60 |
1.25 |
+1.30 |
+79.3% |
|
Trumpet mushrooms |
0.5% |
2.02 |
1.02 |
0.96 |
0.53 |
+1.0 |
+98.0% |
|
Beech mushrooms |
0.4% |
0.85 |
0.75 |
0.37 |
0.66 |
+0.10 |
13.3% |
|
Morel mushrooms |
0.1% |
0.18 |
0.19 |
0.23 |
0.28 |
-0.01 |
-5.3% |
|
Enoki mushrooms |
0.1% |
0.15 |
0.07 |
0.05 |
0.53 |
+0.8 |
+114.3% |
Pricing and Promoting (MULO+ | 52 weeks ending 11/2/2025)
- Specialty mushrooms are retailed at a much higher price per unit and volume than white, crimini and portabella mushrooms.
- Averaging $5.56 per package, prices are stable year-over-year.
- The average price per pound across specialty varieties is stable at $13.97.
- Specialty mushrooms are promoted less often, with an average of 12.8% of volume sales merchandised. This is well below the white, crimini and portabella average.
- Among the bigger varieties, the merchandised share of sales is highest for chanterelle and trumpet and lowest for shiitake.
|
Product |
Share of specialty mushroom sales |
Price per Volume |
Price per Volume % Change vs YA |
Price per Volume % Change vs 2YA |
Price per Unit |
Price per Unit % Change vs YA |
Price per Unit % Change vs 2YA |
Average Weekly ACV Distribution |
|---|---|---|---|---|---|---|---|---|
|
White mushrooms |
— |
$3.96 |
-1.4% |
+0.1% |
$2.65 |
-0.7% |
+0.4% |
21.94 |
|
Crimini mushrooms |
— |
$4.53 |
-1.8% |
-2.8% |
$3.37 |
-1.7% |
-1.8% |
16.35 |
|
Portabella mushrooms |
— |
$5.18 |
-2.5% |
-5.9% |
$2.61 |
-3.4% |
-7.0% |
30.76 |
|
Total specialty mushrooms |
12.77 |
$13.97 |
-0.1% |
+0.8% |
$5.56 |
-0.1% |
+4.4% |
12.77 |
|
Shiitake mushrooms |
9.96 |
$14.94 |
1.2% |
+1.0% |
$5.71 |
+0.7% |
+3.2% |
9.96 |
|
All other fresh mushrooms |
15.23 |
$12.83 |
-12.7% |
-11.3% |
$5.72 |
-10.5% |
-8.1% |
15.23 |
|
Mixed mushrooms |
19.70 |
$10.42 |
4.7% |
+8.2% |
$4.33 |
-0.3% |
+2.3% |
19.70 |
|
Oyster mushrooms |
11.92 |
$13.57 |
7.3% |
+18.6% |
$4.14 |
+9.7% |
+21.7% |
11.92 |
|
Chanterelle mushrooms |
23.63 |
$13.39 |
-11.0% |
-19.3% |
$12.77 |
-10.7% |
-18.6% |
23.63 |
|
Lion’s mane mushrooms |
14.70 |
$16.88 |
9.3% |
+13.6% |
$4.44 |
+3.4% |
+10.9% |
14.70 |
|
Trumpet mushrooms |
20.33 |
$14.69 |
-12.3% |
-11.0% |
$4.31 |
-26.6% |
-31.8% |
20.33 |
|
Beech mushrooms |
3.66 |
$17.11 |
20.7% |
+15.3% |
$3.74 |
+10.5% |
+4.8% |
3.66 |
|
Morel mushrooms |
3.54 |
$52.66 |
10.8% |
+19.9% |
$19.32 |
-21.0% |
+2.4% |
3.54 |
|
Enoki mushrooms |
1.14 |
$4.94 |
50.2% |
+80.2% |
$3.26 |
-4.2% |
-17.4% |
1.14 |
Largest Specialty Mushroom Sellers (MULO+ | 52 weeks ending 11/2/2025)
- Shiitake mushrooms dominate the biggest seller list, representing eight out of the top 10 best sellers.
- 5-ounce sliced organic and conventional shiitake are the two biggest sellers.
- Chanterelle is the only other specialty variety represented in the top 10, along with a 4-ounce mixed mushroom variety.
|
Product |
Package Weight |
Organic Claim |
Preparation |
Dollar Sales |
Dollar Sales % Change vs YA |
Unit Sales |
Unit Sales % Change vs YA |
Volume Sales |
Volume Sales % Change vs YA |
|---|---|---|---|---|---|---|---|---|---|
|
Shiitake fresh mushrooms |
5 oz |
Organic |
Sliced |
$15,190,849 |
-3.3% |
2,729,210 |
-2.9% |
852,878 |
-2.9% |
|
Shiitake fresh mushrooms |
5 oz |
Conventional |
Sliced |
$14,029,214 |
-17.9% |
2,870,651 |
-16.7% |
454,140 |
-16.7% |
|
Chanterelle fresh mushrooms |
16 oz |
Conventional |
No prep |
$5,851,775 |
-15.2% |
454,140 |
-4.3% |
454,140 |
-4.3% |
|
Mixed fresh mushrooms |
4 oz |
Conventional |
Sliced |
$3,626,877 |
-7.8% |
978,968 |
-7.7% |
244,742 |
-4.3% |
|
Shiitake fresh mushrooms |
3.5 oz |
Conventional |
No prep |
$3,214,873 |
-5.9% |
715,881 |
-5.6% |
157,260 |
-5.6% |
|
Shiitake fresh mushrooms |
10 oz |
Conventional |
Sliced |
$2,498,412 |
-9.1% |
313,081 |
-4.2% |
195,676 |
-5.6% |
|
Shiitake fresh mushrooms |
Random weight |
Conventional |
No prep |
$2,410,301 |
-12.3% |
668,657 |
-13.0% |
354,174 |
-13.4% |
|
Shiitake fresh mushrooms |
4 oz |
Organic |
Sliced |
$2,283,469 |
84.3% |
472,504 |
69.0% |
118,126 |
69.0% |
|
Shiitake fresh mushrooms |
3.5 oz |
Conventional |
Sliced |
$1,920,895 |
-14.1% |
451,943 |
-11.9% |
98,885 |
-11.9% |
|
Shiitake fresh mushrooms |
4 oz |
Organic |
No prep |
$1,494,416 |
-0.9% |
366,377 |
-11.9% |
91,594 |
-11.9% |
Regional Differences (MULO+ | 52 weeks ending 11/2/2025)
- Specialty mushroom sales are the highest in the Northeast region, at $23 million. In the Northeast, specialty mushrooms also over-index as a percentage of total fresh mushroom sales in the region, at 9.1%.
- California, the West and the Mid-South are three more regions in which specialty mushrooms represent an above-average share of sales.
- Out of these four regions, California is the only one with growing dollars and unit sales.
|
Geography |
Dollar Sales |
Share of total mushroom sales in the region |
Dollar Sales % Change vs YA |
Unit Sales |
Unit Sales % Change vs YA |
Volume Sales |
Volume Sales % Change vs YA |
|---|---|---|---|---|---|---|---|
|
Total US |
$101.9M |
7.0% |
-6.8% |
18.3M |
-6.7% |
7.3M |
-6.7% |
|
Northeast |
$23.0M |
9.1% |
-7.9% |
4.6M |
-7.5% |
1.9M |
-6.3% |
|
California |
$17.4M |
8.4% |
+0.8% |
2.5M |
+1.2% |
1.2M |
-1.0% |
|
West |
$16.9M |
7.7% |
-2.3% |
2.5M |
-2.7% |
1.1M |
-2.5% |
|
Mid-South |
$14.1M |
8.4% |
-6.3% |
3.1M |
+2.3% |
1.1M |
-0.3% |
|
Southeast |
$12.3M |
6.3% |
-11.2% |
2.4M |
-8.4% |
727K |
-10.6% |
|
Great Lakes |
$10.4M |
4.8% |
-11.7% |
2.1M |
-18.6% |
770K |
-17.9% |
|
South Central |
$4.1M |
4.2% |
-14.0% |
569K |
-13.4% |
292K |
-12.7% |
|
Plains |
$3.6M |
3.9% |
-14.9% |
586K |
-23.8% |
209K |
-19.8% |
Specialty Mushroom Market Insights & Key Takeaways
- Specialty mushrooms are a niche offering in traditional food retail outlets and losing some momentum.
- Dollars, units, and volume sales are all declining. The segment is not keeping pace with the broader mushroom category and is disproportionately weighted toward one variety.
- Shiitake dominates the segment, but sales are soft. The top sellers list reflects reliance on sliced and small pack-size shiitake. Most of the other larger specialty varieties, including mixed, oyster, and chanterelle, also saw declines.
- The growth is concentrated in small, emerging varieties, including lion’s mane, trumpet, beech and enoki, but all are gains off very small bases and impacted by distribution growth.
- Specialty mushroom distribution is far below that of whites and browns. Shiitake and oyster have the highest distribution among specialties, while all others remain under 5%, despite some growing from tiny bases. Distribution experienced a 3-point drop in stores carrying specialties and limited placement outside coastal/urban regions suggests that retail availability could be an opportunity in areas that are a demographic match for specialty mushroom shoppers (younger, high-income foodies).
- Premium pricing remains stable, with little promotion given the foodie nature of the category. At the same time, the high(er) price per unit may limit trail in a value-driven environment. Combined with minimal merchandising support, this reinforces the category’s niche status.
- Regional performance is uneven. The Northeast is the biggest specialty region and over-indexes in share, but California is the only region showing dollar and unit growth.
What this means
- Reversing distribution losses is essential. This is the biggest controllable lever for stabilizing specialty performance.
- Broader promotion and education (usage ideas, nutrition messaging and preparation inspiration) may help close the trial gap.
- Innovation and assortment optimization could emphasize growing varieties such as lion’s mane, enoki and trumpet.
- Right-sizing shiitake and mixed offerings may be necessary given some sales softness.
- Targeted regional strategies (especially in California and the Northeast) can accelerate gains where interest is highest.
Partner with South Mill Champs for Specialty Mushroom Growth
Turn specialty mushroom insights into action with a trusted partner. South Mill Champs works with retailers, distributors, and foodservice operators to improve category performance, expand distribution, and optimize product assortment using data-driven strategies.
From reliable supply to industry-leading market insights, our team helps you stay ahead of evolving mushroom market trends and consumer demand.
Thank you!

Data and insights in this report are sourced from research conducted by the Mushroom Council, based on Circana, Integrated Fresh, MULO+ for the 52 weeks ending 11/2/2025, released November 2025. Content has been rebranded for marketing purposes with acknowledgement to the Mushroom Council.
Contact South Mill Champs for Specialty Mushroom Solutions & Support
Have questions about organic mushroom sales, distribution, or product offerings? Have questions about specialty mushroom sales, distribution, or product offerings? Connect with South Mill Champs to access expert guidance, reliable supply, and data-driven insights tailored to your business.
Our team works with retailers, distributors, and foodservice operators to improve mushroom category performance, expand product offerings, and drive growth through proven strategies.Our team is here to help.
All fields are required